Thursday, 6 November 2014

Pass Presentation Variable To the Title View Using Dashboard Prompt?

When you select a value from the dashboard prompt , the title is reflected correctly with the selected value in dashboard prompt.

Create the report:

  • Create an analysis using SampleAppLite repository with following criteria:
  • Add a Filter ->Product: Brand and make it 'Is prompted' (we will be making Brand as the presentation variable)
  • Click on Result and Edit the Title.
  • In the 'subtitle' field , Enter the name of presentation variable, say @{Brand}
  • Save the report as 'Presentation var'

Create the Dashboard prompt

  • Create a New Dashboard Prompt (New->Dashboard Prompt)
  • Add a Column Prompt: Product ->Brand
  • Expand the Options and Set a variable to 'Presentation variable' and Enter 'Brand' in the field below.
  • Save the dashboard prompt as 'PVprompt'

Create the Dashboard Page

  • Create a new board and name it as :PVDashboard
  • Drag and drop the Dashboard Prompt created from Section 2 into the dashboard page
  • Drag and drop the report created from Section 1 to the dashboard page
  • Save the Dashboard page and run it.
  • When there is no value selected in the dashboard prompt, the subtitle is displayed as '@{Brand}
  • When you select a value for Dashboard prompt : say 'BizTech', it is displayed correctly as BizTech as shown below:
  • To fix this issue, Do the following:
  • Edit the Title view from Results tab and add a default value for All selection for eg, 'All Brand' in this case: @{Brand}{All Brand} and Save the title.
  • Save the Dashboard PVDashboard,and Run it .Now the Presentation Variable is displayed correctly when you don't select any value for the Dashboard prompt.

Happy Stay. :-)

Wednesday, 5 November 2014

Send Master-Detail Events in OBIEE

Master-detail linking of views:

Master-detail linking of views enables you to establish a relationship between two or more views such that one view, called the master view, drives data changes in one or more other views, called detail views.

For example, suppose you have the following two views:
  • A table that shows Dollars by "Per Name Year"
  • A graph that shows Dollars by LOB with "Per Name Year" on a section slider
Using the master-detail linking functionality, you can link the two views so that when you click a particular "Per Name Year" in the table, the "Per Name Year" on the section slider of the graph as well as the data in the graph changes to reflect the "Per Name Year" that was clicked on the table. 

For example, clicking 2008 in the table in the "Per Name Year" column, positions the thumb in the section slider on 2008 and updates the data in the graph to the data for 2008.

Note: Master-detail linking is not supported when you click the plot area of a graph.

What Are Master Views actually?

A master view drives data changes in one or more detail views. A view becomes a master when you set up the interaction of a column in the view to send master-detail events on designated channels. This column is known as the master column.

The master column is the column whose values when clicked send a master-detail event, which passes information to update the data in a detail view.

A master view can be in the same analysis as the detail view or in a different analysis. A master view can update data in one or more detail views.

The following types of views can be master views:
  • Graph
  • Funnel graph
  • Gauge Map
  • Pivot table
  • Table
  • Trellis (only the outer edges, not the inner visualizations)

What Are Channels?

A channel links a master view to a detail view. It is the vehicle that carries master-detail events from the master view to the detail view. The same channel must be used for both the master view and the detail view in a master-detail relationship, for example, PassYear. Note that the channel name is case sensitive.

What Are Detail Views?

A detail view is a view that listens for and responds to master-detail events sent by a master view on a specified channel. A view becomes a detail view, when you set up the view to listen to master-detail events.

A detail view includes one or more columns whose values are changed directly by the information passed by a master-detail event. These columns are known as detail columns.

A detail view can:
  • listen for master-detail events from multiple master views
  • be in the same analysis as the master view or in a different analysis
  • not act as a master to another view
Say for example, we'll take above scenario.

  • Go to criteria of the above example.
  • Go to column properties of "Per Name Year"
  • Move to Interaction tab of the column properties.
  • In Primary Interaction, select Send Master-Detail Events and Specify Channel name for this master detail event.
  • Click OK.
  • Move to the Results section of the analysis.
  • Click an Edit mode of the bar graph view.
  • Move "Per Name Year" to Sections and select "Display as Slider".
  • Now click Edit Graph Properties button of the graph.
  • Select Master-Detail check box, the Text Box for Event Channels will get enabled.
  • Remember the channel we have defined in previous step. i.e. PassYear
  • Click OK.
  • Click Done to return to the analysis page.
  • Now you can select any of the value for Per Name Year column in this analysis, the corresponding details report i.e. here Bar Graph View will get changed.

Happy stay.. :-)

Tuesday, 4 November 2014

Dynamic columns in reports / dashboards - OBIEE 11g

I got this requirement from my client, i.e. we can select any of the dimension listed over there and according to that, the report on the dashboard should get changed.

To be more clear, one example I will illustrate on this. The scenario is,

Time, Product,  Offices, etc.  are the dimensions in your repository. On this, there will be three radio buttons having values Year, Product Type, and Office.

There's a report which will be having one table view and bar graph for that. (just for example, it can view)

Now the actual requirement is, when you select any of the value from radio button list, the report's dimension should get changed. 

For example, suppose the default view of the report is "Year" vs. "Revenue".

Now when you select "Product Type" value from the list, the report will get changed as "Product Type " vs. "Revenue".

To achieve this, we can refer the following steps.
  • Create one sample report as follows,

  • Add bar graph to this analysis.
  • Create one dashboard level prompt.
  • Click New to add a new prompt.
  • Put the following values as per our example.
  • In the display section, you will be having following screenshot.

  • Click OK when you finished. Save this prompt.
  • Open the previously saved analysis in EDIT mode.
  • Go to the Criteria tab.
  • Select Column Properties of the "Per Name Year" column.
  • Here, you will be setting the presentation variable name as a dimension for the report.

  • Save the analysis.
  • Now just drag and drop this prompt & report to the dashboard.
  • Save the dashboard and click on Run button.

  • Here you can see, the default dimension is set to "Time Per Year".

  • Now change the dimension value from the list to change the attributes of the reports.

Related links,

Happy stay.. :-)


Thursday, 21 August 2014

Purge cache remotely - OBIEE

To see reports with the most up-to-date data from the latest extract-transform-load (ETL) process, we typically purge the Oracle BI Server Cache using a common job called, "Cache Purge."

There are several ways to purge Oracle BI Server Cache:
  • iBots/Agents bursting
  • Dynamic repository variables 
  • A nqcmd command
In today's article, we will see nqcmd command line features.

1. Create a text file purgecache.txt. Put the below BI SQL in it.

    call SAPurgeAllCache();

2. Create one batch file containing following batch operations, say Purge.bat

cd C:\Program Files\Oracle Business Intelligence Enterprise Edition Plus Client Tools\oraclebi\orahome\bifoundation\server\bin

nqcmd -d DemoEnv -u weblogic -p ******* -s D:\CacheTest\purgecache.txt

3. Following is the description of the nqcmd command line arguments for BIServer (nqsserver):

-d = Datasource / ODBC DSN.
-u = username.
-p = password.
-s = inputsqlsfile.
-o = outputfile. counters will be in outputfile_Counters.txt.
-td <secs> = timeduration in secs. nqcmd will run until <secs> elapses.
-qsel r = select queries random manner from inputsqlsfile.
-ds <secs> = dump statistics to outputfile_Counters.txt every <secs>.
-T = Timer is on. Otherwise you won’t get correct statistics.
-t <number> = generate users . if you give -t 50, 50 users will be there.
-q = turn off row output - mandatory flag for load testing.
-n <number> = used for login test run for <number> iterations.
-w = thinktime (in seconds).

3. Open command prompt and run the Purge.bat file to purge the BI Server cache.

4. Press Enter to run the batch file.

5. You can see the log over here, how many entries you have purged and rest of the details.

Happy BI..!!

Friday, 8 August 2014

Installing Microsoft Loopback Adapter on Windows 7 machine.

Note:

Almost 75% of the OBIEE installation failures are because of IP related issues. So, while installing OBIEE, I simply advice you to disconnect your machine from network or just disable all the adapters installed on your machine except this "Microsoft Loopback Adapter". 

The Microsoft Loopback adapter is a testing tool for a virtual network environment where network access is not available. Use this drivers to assign the static address to your machine where network access is not available.

Following are the steps to install Microsoft Loopback Adapter on Windows 7 machine.
  1. Click the Start menu.
  2. Search for “cmd".
  3. Right-click on “cmd” and select “Run as Administrator”
  4. Enter “hdwwiz.exe
  5. In the "Welcome to the Add Hardware Wizard", click Next.
  6. Select "Install the hardware that I manually select from a list (Advanced)" and click Next.
  7. Scroll down and select "Network adapters" and click Next.
  8. Select under Manufacturer "Microsoft" and then under Network Adapter "Microsoft Loopback Adapter" and click Next.
  9. Click Finish.
  10. Go to Control Panel > Network and Internet > Network and Sharing Center > Change Adapter Setting.
  11. Double click on the Microsoft Loopback Adapter you have installed.
  12. You can use the following figures as for example.

Now refer the following fig. to configure your IP.
1. Go to the path, C:\Windows\System32\drivers\etc where the host file is located. Edit this hosts file as below.


(If you got the error saying, Please check if this file is opened in another program.
Change the file permissions. Allow read, write, execute access to the your you are currently logged in.)

2. Finally, test that these new network settings work as expected by selecting Start > Command Prompt, then typing ping [machine name], so that the output looks like this:

You are done..!! :-)

Friday, 18 July 2014

Excel & OBIEE 11g on Windows - ODBC drivers Problem

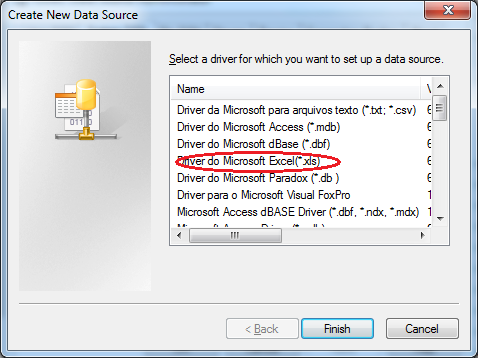
In OBIEE, you might face this issue while creating a DSN to access MS-Excel as a source database. Even if you have installed OBIEE setup, MS-Office setup successfully, etc.., you will not be able to create a DSN pointing to an Excel source on your system.

This is because, you have installed a 32 bit version of MS-Office on your 64 bit system.

A 64-bit version of the Microsoft Windows operating system includes the following versions of the Microsoft Open Database Connectivity (ODBC) Data Source Administrator tool (Odbcad32.exe):
  • The 32-bit version of the Odbcad32.exe file is located in the %systemdrive%\Windows\SysWoW64 folder.
  • The 64-bit version of the Odbcad32.exe file is located in the %systemdrive%\Windows\System32 folder.
You might be wondering.. What's this stuff?? :-) Let me try to clear you these things. 

With the Odbcad32.exe file from %systemdrive%\Windows\System32, you are not able to create a DSN for any Excel file. There will be no any drivers for Excel data source.

Unlike this, with the Odbcad32.exe file from %systemdrive%\Windows\SysWoW64, you will be able to create a DSN for Excel pointing to your source excel file. 

But you will not be able to access this DSN through BI Admin Tool.

So, to overcome with this issue, we need to install 64-bit Microsoft Access components?
You can download this component from this link, (Download 64 bit)

Install this file,


But still, didn't went well..!! Don't worry.. :-)

Use the /passive parameter to force install of the 64-bit ODBC drivers:

Open your command prompt, & go to the downloaded folder, and type the following command.

Now open Odbcad32.exe file from %systemdrive%\Windows\System32 location, you are ready to create DSN for excel source file.

Create one sample DSN,

Make sure, this DSN is available in Admin Tool also to import data from source file mentioned in that DSN.

Sucess..!! :-)

Adding Logo's to the Title of the OBIEE reports.

What if you would like to set some standard logo for that report?

Yes, there is an option in OBIEE where we can set the logo for an individual report. It is possible to add images into title of the view. This can make title views look more graphically appealing and can also help the user to understand what the title view is conveying.

You can find all the images that comes with the OBIEE installation at the following path,

C:\Middleware\user_projects\domains\bifoundation_domain\servers\bi_server1\tmp\_WL_user\analytics_11.1.1\7dezjl\war\res\s_blafp\images
  • Create any sample report.
  • Go to the results tab & edit the Title view of the report..
  • Set the title for the report. (By default, this title is same as report name). 
  • Set other fields in you are interested in further formatting.
  • In the logo, you give the path for that logo/image. It can be,
    • Relative path - The logo will accessible only on the localhost.
    • URL - A complete URL to that image.
  • Relative path - 
Note: When running in a secured environment, only resources that are located on the Oracle BI Presentation Server may be used. These resources are referenced using a relative path prefixed with "fmap:".

  • URL - 

  • For further exploration, lets fill the Subtitle & Help URL fields. 
  • Set Started Time to "Display Date and Time". This will print the latest date and time when this report is executed against the database.

You can see the question mark (?) button in the title of the report, where you can give a link to any other BI content, website, etc.

Happy blogging.