Thursday, 26 September 2013

Oracle Group by clause along with ROLLUP or CUBE operators


Use the ROLLUP OPERATOR to produce subtotal values, ROLLUP IS AN EXTENSION OF GROUP BY CLAUSE, Use the CUBE OPERATOR to produce cross-tabulation values.  Use the GROUPING function to identify the row values created by ROLLUP or CUBE.  These operators and GROUPING function can best be used ALONG WITH GROUP FUNCTIONS, as group functions operate on a set of rows to give one result per group.

  • Examples of Rollup:

          1. SELECT e.department_id, SUM(e.salary)
                       FROM employees e
                                   WHERE e.department_id < 30 
                                                 GROUP BY ROLLUP(e.department_id);
             Results:

          2. SELECT e.department_id, e.job_id, SUM(e.salary) 
                         FROM employees e
                                     WHERE e.department_id < 30 
                                                    GROUP BY ROLLUP(e.department_id, e.job_id);
              Results: 

  •    Example of CUBE:

The cube operator is used to produce results sets that are typically used for cross-tabular reports. This means Rollup produces only one possible subtotaling where as Cube produces subtotal for all possible conditions of grouping specified in the group by clause and a grand total.


       1. SELECT e.department_id, SUM(e.salary) 
                          FROM employees e
                                      WHERE e.department_id < 30 GROUP BY CUBE(e.department_id);
           Results:

      2. The following query produces subtotaling results based on job, based on deptno and based on the                 individual jobs(clerk or analyst or manager etc in dept 10 and 20)  


          SELECT e.department_id, e.job_id, SUM(e.salary)
                         FROM employees e
                                     WHERE e.department_id < 30 GROUP BY CUBE(e.department_id, e.job_id);

          Results:


          Tuesday, 17 September 2013

          What is an OLAP and Explain OLAP's advantages with example?

          OLAP (or Online Analytical Processing) has been growing in popularity due to the increase in data volumes and the recognition of the business value of analytics. It uses database tables (fact and dimension tables) to enable multidimensional viewing, analysis and querying of large amounts of data. E.g. OLAP technology could provide management with fast answers to complex queries on their operational data or enable them to analyze their company's historical data for trends and patterns.

          OLAP allows business users to slice and dice data at will. Normally data in an organization is distributed in multiple data sources and are incompatible with each other. A retail example: Point-of-sales data and sales made via call-center or the Web are stored in different location and formats. It would a time consuming process for an executive to obtain OLAP reports such as - What are the most popular products purchased by customers between the ages 15 to 30?

          Part of the OLAP implementation process involves extracting data from the various data repositories and making them compatible. Making data compatible involves ensuring that the meaning of the data in one repository matches all other repositories. An example of incompatible data: Customer ages can be stored as birth date for purchases made over the web and stored as age categories (i.e. between 15 and 30) for in store sales.The major OLAP vendors are Hyperion, Cognos, Business Objects, MicroStrategy.
          OLAPs are designed to give an overview analysis of what happened. Hence the data storage (i.e. data modeling) has to be set up differently. The most common method is called the star design.


          The central table in an OLAP start data model is called the fact table. The surrounding tables are called the dimensions. Using the above data model, it is possible to build reports that answer questions such as:

          • The supervisor that gave the most discounts.
          • The quantity shipped on a particular date, month, year or quarter.
          • In which pincode did product A sell the most.

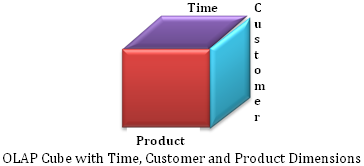
          To obtain answers, such as the ones above, from a data model OLAP cubes are created. OLAP cubes are not strictly cuboids - it is the name given to the process of linking data from the different dimensions. The cubes can be developed along business units such as sales or marketing.Or a giant cube can be formed with all the dimensions.

          OLAP can be a valuable and rewarding business tool. Aside from producing reports, OLAP analysis can aid an organization evaluate balanced scorecard targets.

          Business intelligence refers to computer-based methods for identifying and extracting useful information from business data. OLAP (online analytical processing) as the name suggest is a compilation of ways to query multi-dimensional databases.

          OLAP is a class of systems, which provide answers to multi-dimensional queries.Typically OLAP is used for marketing, budgeting, forecasting and similar applications. It goes without saying that the databases used for OLAP are configured for complex and ad-hoc queries with a quick performance in mind. Typically a matrix is used to display the output of an OLAP. The rows and columns are formed by the dimensions of the query. They often use methods of aggregation on multiple tables to obtain summaries.For example,it can be used to find out about the sales of this year in Wal-Mart compared to last year? What is the prediction on the sales in the next quarter? What can be said about the trend by looking at the percentage change?
          OLAP tools provides multidimensional data analysis and they provide summaries of the data but contrastingly, data mining focuses on ratios, patterns and influences in the set of data.


          Monday, 2 September 2013

          Joins in Oracle with examples

          1. The purpose of a join is to combine the data across tables.

          2. A join is actually performed by the where clause which combines the specified rows of tables.

          3. If a join involves in more than two tables then oracle joins first two tables based on the joins condition and then compares the result with the next table and so on.

          Types:
          1. Equi join
          2. Non-equi join
          3. Self join
          4. Natural join
          5. Cross join
          6. Outer join
            • Left Outer join
            • Right Outer join
            • Full Outer join
                7. Inner join
                8. On clause
                9. Using clause

          Assume that, we have following tables in Oracle.

          SQL> select * from dept;

          SQL> select * from emp;

          1. Equi Join: 

          A join which contains an equal to ‘=’ operator in the joins condition.

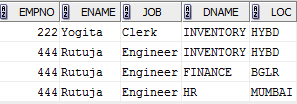
          SQL> select empno,ename,job,dname,loc from emp e,dept d where e.deptno=d.deptno;


          2. Non-Equi Join:

          A join which contains an operator other than equal to ‘=’ in the joins condition.

          SQL> select empno,ename,job,dname,loc from emp e,dept d where e.deptno > d.deptno;


          3. SELF JOIN

          Joining the table itself is called self join.

          SQL> select e1.empno,e2.ename,e1.job,e2.deptno from emp e1,emp e2 where e1.empno=e2.mgr;


          4. NATURAL JOIN

          Natural join compares all the common columns.

          SQL> select empno,ename,job,dname,loc from emp natural join dept;


          5. CROSS JOIN

          This gives the cross products.

          SQL> select empno,ename,job,dname,loc from emp cross join dept;


          6. OUTER JOIN

          Outer join gives the non-matching records along with matching records.

          • LEFT OUTER JOIN
                     This will display the all matching records and the records which are in left hand side table those that are not in right hand side table.

          SQL> select empno,ename,job,dname,loc from emp e left outer join dept d on(e.deptno=d.deptno);               OR

          SQL> select empno,ename,job,dname,loc from emp e,dept d where e.deptno=d.deptno(+);


          • FULL OUTER JOIN
          This will display the all matching records and the non-matching records from both tables.


          7. INNER JOIN

          This will display all the records that have matched.

          SQL> select empno,ename,job,dname,loc from emp inner join dept using(deptno);


          8. Using Clause

          SQL> select empno,ename,job ,dname,loc from emp e join dept d using(deptno);


          9. On Clause:

          SQL> select empno,ename,job,dname,loc from emp e join dept d on(e.deptno=d.deptno);


          Friday, 30 August 2013

          OBIEE Architecture and its components.

          In OBIEE 11.1.1.5, the “regular” installation method is called the Enterprise Install, and gives you a logical architecture that looks like the diagram below:
          The basic unit of organization for an OBIEE 11g system is called an Oracle BI Domain. An Oracle BI Domain consists of Java, and non-Java components, with the Java components being organized into a single WebLogic Domain. Over time, you can scale-out this WebLogic domain to include additional managed servers on additional hosts, though you need to purchase the additional WebLogic Server Enterprise Edition to make use of this.


          The 11.1.1.5 release of OBIEE also introduced a new install type, the “Simple Install”, which did away with the managed server, along with the Node Manager server, reducing the memory footprint of the installation but at the cost of future expandability.
          The WebLogic domain, for an Enterprise Install, initially consists of a single Administration Server and Managed Server, with the Administration Server containing the WebLogic Administration Console, Oracle Enterprise Manager and Java MBeans applications, and the Managed Server containing all the OBIEE Java components such as BI Publisher, the Action Service, the BI Middleware application and the BI Office application.
          What we know of as the BI Server, BI Presentation Server and other “traditional” OBIEE server components are referred to collectively as System Components, and are installed, alongside the Java components, on each host. Within each host, each set of system components are collectively known as an Instance, with each instance being managed by its own installation of OPMN, or Oracle Process Manager and Notification Server. OPMN controls and monitors the various system components within it’s instance. When you scale-out an OBIEE system over several hosts, you can end-up with several instances, once for each host.
           Collectively, these instances together are known as a Farm, and the farm is what Enterprise Manager manages when you log in and make configuration changes.
          The other topic, in terms of internals, that I covered in the session was around the Oracle BI Systems Management API. I’ll cover this in more detail in my presentation on OBIEE Systems Management on Thursday, but understanding the Systems Management API, the MBeans that make them available, and how Enterprise Manager uses these under the covers is to me, the key to understanding how OBIEE 11g works under the covers.

          OBIEE Components: 

          The Oracle Business Intelligence Suite Enterprise Edition Plus (EE) is a comprehensive suite of enterprise BI products, delivering the full range of BI capabilities including interactive dashboards, full ad hoc, proactive intelligence and alerts, enterprise and financial reporting, real-time predictive intelligence, disconnected analytics, and more. In addition to providing the full gamut of BI functionality, the Oracle Business Intelligence Suite EE Plus platform is based on a proven, modern Web Services-Oriented Architecture that delivers true next-generation BI capabilities.
          Oracle Business Intelligence Enterprise Edition Plus has the following components:

          Oracle BI Server: 

          The foundation of the Oracle Business Intelligence Suite Enterprise Edition Plus platform is a true BI server that is designed to be highly scalable, optimizing concurrency and parallelism to make the value of BI applications available to the largest possible audience. It provides centralized data access and calculation, essentially creating a large pipe through which anyone can consume any information in any form anywhere in the enterprise. The BI server is central to all of the business processes that consume information, including dashboards, ad hoc queries, intelligent interaction capabilities, enterprise and production reporting, financial reporting, OLAP analysis, data mining, and other Web Service-based applications (J2EE and .NET). All of these applications require rich access to broad sets of data across the enterprise, and they all require a sophisticated calculation and aggregation infrastructure that the platform provides to deliver value.
          The platform supports a full complement of access, analysis, and information delivery options, all in one fully integrated Web environment. Each of these components serves different audiences in the organization who have different appetites for the same underlying data, but need to access it in different ways. But unlike other BI tools, all components are integrated on one common architecture, enabling a seamless and intuitive user experience.

          Oracle BI Answers:

          Oracle BI Answers provides true end user ad hoc capabilities in a pure Web architecture. Users interact with a logical view of the information—completely hidden from data structure complexity while simultaneously preventing runaway queries—and can easily create charts, pivot tables, reports, and visually appealing dashboards, all of which are fully interactive and drillable and can be saved, shared, modified, formatted, or embedded in the user's personalized Oracle BI Intelligence Dashboards. The results are new levels of business user self-sufficiency in an environment that is fully secure and controlled by IT.

          Oracle BI Interactive Dashboards:

          Oracle BI Interactive Dashboards provides any knowledge worker with intuitive, interactive access to information that is actionable and dynamically personalized based on the individual's role and identity. In the Oracle BI Intelligence Dashboards environment, the end user is working with live reports, prompts, charts, tables, pivot tables, graphics, and tickers in a pure Web architecture. The user has full capability for drilling, navigating, modifying, and interacting with these results. Oracle BI Intelligence Dashboards can also aggregate content from a wide variety of other sources, including the Internet, shared file servers, and document repositories.

          Oracle BI Delivers:

          Oracle BI Delivers is a proactive intelligence solution that provides business activity monitoring and alerting that can reach users via multiple channels such as email, dashboards, and mobile devices. Oracle BI Delivers includes a full Web-based self-service alert creation and subscription portal. This next-generation product can initiate and pass contextual information to other alerts to execute a multi-step, multi-person  and multi-application analytical workflow. Furthermore, it can dynamically determine recipients and personalized content to reach the right users at the right time with the right information.


          Oracle BI Disconnected Analysis:

          Full business intelligence functionality for the mobile professional, enabling fully interactive dashboards and ad hoc analysis while disconnected from the corporate network.

          Offers BI Answers and Dashboards to mobile professionals on computers disconnected from the network. It provides the same interface for users whether they are working in connected or disconnected mode.

          Oracle BI Publisher:

          Oracle BI Publisher (formerly known as XML Publisher) offers efficient; scalable reporting solution available for complex, distributed environments. It provides a central architecture for generating and delivering information to employees, customers, and business partners - both securely and in the right format. Oracle BI Publisher report formats can be designed using Microsoft Word or Adobe Acrobat - tools most users are already familiar with. Oracle BI Publisher also allows you to bring data in from multiple data sources into a single output document. Reports can be delivered via printer, e-mail, fax, WebDav, or publish your report to a portal. Oracle BI Publisher can be used as a standalone reporting product or integrated with the Oracle Business Intelligence Suite Enterprise Edition Plus. When used as part of the suite, Oracle BI Publisher leverages common dashboarding, metadata, security, calculation, caching, and intelligent request generation services.

          Oracle BI Briefing Books:

          Reports captured series of snapshots of Oracle BI Dashboards.

          We can store a static snapshot of dashboard pages or individual requests in one or more briefing books. We can then download and share briefing books for viewing offline.

          Briefing books and their content can be updated, scheduled, and delivered using Oracle BI Delivers.

          Used to store/capture a series of static images of pages/requests at server, allowing the information to be viewed offline and shareable with other users and also we can keep track of changes offline.

          Hyperion Interactive Reporting:

          The Hyperion Interactive Reporting (Interactive Reporting) module provides executives, business users and analysts with intuitive user-directed query and analysis capabilities. An intuitive and highly interactive interface that lets users design dashboards, and quickly monitor and navigate relevant information. It's easy to deploy, provides direct access to data locked in transactional systems, and leverages information from existing data stores to deliver unequaled business intelligence reporting.

          Hyperion SQR Production Reporting:

          The Hyperion SQR Production Reporting (Production Reporting) module features an SQR programming environment to generate high volume, presentation-quality formatted reports. Production Reporting delivers the business context for key metrics by consolidating information from core business applications throughout the enterprise. With built-in security, report categorization, automatic versioning and archiving, Production Reporting software provides a complete solution for Web-based and print-ready report distribution and management.

          Hyperion Financial Reporting:

          The Hyperion Financial Reporting (Financial Reporting) module is a special-purpose financial reporting solution that generates formatted, book-quality financial and management reports that comply with regulations and external requirements. Financial Reporting features embedded financial intelligence that supports currency translations, GAAP, IFRS, and other financial standards. In addition, the module supports XBRL for electronic transmission and filing of financial information.

          Hyperion Web Analysis:

          Hyperion Web Analysis (Web Analysis) software delivers out-of-the-box online analytical processing (OLAP) analysis, presentation, and reporting for the extended enterprise. Web Analysis provides executives, business users, and analysts with intuitive user-directed Web-based query and analysis capabilities available, accessed through context-driven, thin-client user interface.

          Wednesday, 21 August 2013

          The Basic's One in BI..

          Business Intelligence:

          Business intelligence (BI) is a set of theories, methodologies, processes, architectures, and technologies that transform raw data into meaningful and useful information for business purposes. BI can handle large amounts of information to help identify and develop new opportunities. Making use of new opportunities and implementing an effective strategy can provide a competitive market advantage and long-term stability.

          BI technologies provide historical, current and predictive views of business operations. Common functions of business intelligence technologies are reporting, online analytical processing, analytics, data mining, process mining, complex event processing, business performance management, benchmarking, text mining, predictive analytics and prescriptive analytics.

          Though the term business intelligence is sometimes a synonym for competitive intelligence (because they both support decision making), BI uses technologies, processes, and applications to analyze mostly internal, structured data and business processes while competitive intelligence gathers, analyzes and disseminates information with a topical focus on company competitors. If understood broadly, business intelligence can include the subset of competitive intelligence.

          History:

          In a 1958 article, IBM researcher Hans Peter Luhn used the term business intelligence. He defined intelligence as: "the ability to apprehend the interrelationships of presented facts in such a way as to guide action towards a desired goal.

          Business intelligence as it is understood today is said to have evolved from the decision support systems that began in the 1960s and developed throughout the mid-1980s. DSS originated in the computer-aided models created to assist with decision making and planning. From DSS, data warehouses, Executive Information Systems, OLAP and business intelligence came into focus beginning in the late 80s.

          In 1989, Howard Dresner (later a Gartner Group analyst) proposed "business intelligence" as an umbrella term to describe "concepts and methods to improve business decision making by using fact-based support systems. 

          Business Intelligence and Data Warehousing:

          Often BI applications use data gathered from a Data Warehouse or a Data Mart.A data warehouse is a copy of transactional data so that it facilitates in decision support. However, not all data warehouses are used for business intelligence, nor do all business intelligence applications require a data warehouse.

          Business Intelligence and Business Analytics:

          Business intelligence should be divided into querying, reporting, OLAP, an "alerts" tool, and business analytics. In this definition, business analytics is the subset of BI based on statistics, prediction, and optimization.

          Applications in an Enterprise:

          Business intelligence can be applied to the following business purposes, in order to drive business value.

              Measurement – program that creates a hierarchy of performance metrics.

              Analytics – program that builds quantitative processes for a business to arrive at optimal decisions and to perform business knowledge discovery. Frequently involves: data mining, process mining, statistical analysis, predictive analytics, predictive modeling, business process modeling, complex event processing and prescriptive analytics.

              Reporting/Enterprise reporting – program that builds infrastructure for strategic reporting to serve the strategic management of a business, not operational reporting. Frequently involves data visualization, executive information system and OLAP.

              Collaboration/Collaboration platform – program that gets different areas (both inside and outside the business) to work together through data sharing and electronic data interchange.

              Knowledge management – program to make the company data driven through strategies and practices to identify, create, represent, distribute, and enable adoption of insights and experiences that are true business knowledge. Knowledge management leads to learning management and regulatory compliance.

          Monday, 19 August 2013

          Success factors of implementation..

          Before implementing a BI solution, it is worth taking different factors into consideration before proceeding. According to Kimball et al., these are the three critical areas that you need to assess within your organization before getting ready to do a BI project:

          1. The level of commitment and sponsorship of the project from senior management
          2. The level of business need for creating a BI implementation.
          3. The amount and quality of business data available. 


          Business sponsorship:

          The commitment and sponsorship of senior management is according to Kimball, the most important criteria for assessment. This is because having strong management backing helps overcome shortcomings elsewhere in the project. However, as Kimball state: “even the most elegantly designed DW/BI system cannot overcome a lack of business [management] sponsorship”.

          It is important that management personnel who participate in the project have a vision and an idea of the benefits and drawbacks of implementing a BI system.

          Business needs:

          Because of the close relationship with senior management, another critical thing that must be assessed before the project begins is whether or not there is a business need and whether there is a clear business benefit by doing the implementation. The needs and benefits of the implementation are sometimes driven by competition and the need to gain an advantage in the market.
          Companies that implement BI are often large, multinational organizations with diverse subsidiaries. A well-designed BI solution provides a consolidated view of key business data not available anywhere else in the organization, giving management visibility and control over measures that otherwise would not exist. 

          Amount and quality of available data:

          Without good data, it does not matter how good the management sponsorship or business-driven motivation is. Without proper data, or with too little quality data, any BI implementation fails. Before implementation it is a good idea to do data profiling. This analysis identifies the “content, consistency and structure of the data. This should be done as early as possible in the process and if the analysis shows that data is lacking, put the project on the shelf temporarily while the IT department figures out how to properly collect data.

          These essential steps of business intelligence includes but not limited to:
          1. Go through business data sources in order to collect needed data.
          2. Convert business data to information and present appropriately.
          3. Query and analyze data.
          4. Act on those data collected.

          User aspect:

          When gathering the requirements from the business users, the local IT department should also be consulted in order to determine to which degree it is possible to fulfill the business's needs based on the available data. 

          Taking on a user-centered approach throughout the design and development stage may further increase the chance of rapid user adoption of the BI system.

          BI chances of success can be improved by involving senior management to help make BI a part of the organizational culture, and by providing the users with necessary tools, training, and support.

          Training encourages more people to use the BI application.

          BI Portals:

          A Business Intelligence portal (BI portal) is the primary access interface for Data Warehouse (DW) and Business Intelligence (BI) applications. The BI portal is the users first impression of the DW/BI system. It is typically a browser application, from which the user has access to all the individual services of the DW/BI system, reports and other analytical functionality. 

          The BI portal must be implemented in such a way that it is easy for the users of the DW/BI application to call on the functionality of the application.

          The BI portal needs to be easy to use and understand, and if possible have a similar look and feel as other applications or web content of the organization the DW/BI application it is designed for consistency.

          The following is a list of desirable features for web portals in general and BI portals in particular:

          Usable: User should easily find what they need in the BI tool.

          Content Rich: The portal is not just a report printing tool, it should contain more functionality such as advice, help, support information and documentation.

          Clean: The portal should be designed so it is easily understandable and not over complex as to confuse the users.

          Current: The portal should be updated regularly.

          Interactive: The portal should be implemented in a way that makes it easy for the user to use its functionality and encourage them to use the portal. Scalability and customization give the user the means to fit the portal to each user.

          Value Oriented: It is important that the user has the feeling that the DW/BI application is a valuable resource that is worth working on..